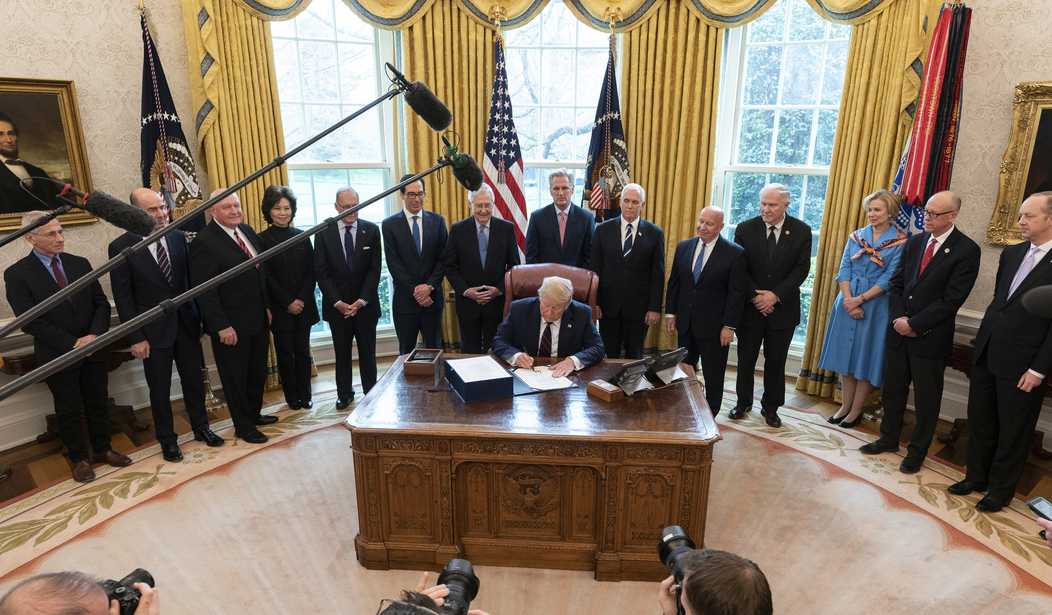

President Donald J. Trump signs the “Coronavirus Aid, Relief, and Economic Security (CARES) Act,” a $2.2 trillion emergency assistance bill in response to the coronavirus pandemic Friday, March 27, 2020, in the Oval Office of the White House. (Official White House Photo by Shealah Craighead)
This is the 12th in a series of nightly updates regarding Wuhan Virus numbers in these United States.
IMPORTANT CAVEAT: Worldometers continues to revise their data in a major fashion well after their “as of” time of 2359Z.** For the immediate future, I will report those numbers and post the graphs accordingly. As Worldometers adjusts them, I will go back and adjust the numbers in the nightly report. Technical issues preclude adjusting the graph after publication. I am looking into resolving this issue. More to follow.
As of 2359 GMT (Worldometers site) March 29, 2020, the U.S. Mortality Rate (M/R) (calculated by dividing the number of reported U.S. Infections into the number of reported U.S Fatalities) was 1.75%, down from 1.79% yesterday.
Red State will continue to publish this Wuhan Virus Update showing total reported U.S. Cases and Total U.S. Fatalities from the disease, along with appropriate commentary regarding any observable trends until it’s determined to be no longer useful to our readers.

On the left, this first chart shows the data table, starting February 29, the date of the first reported U.S fatality, and continuing until today. On the right, are two graphical representations of the data. The top graph shows the decline of the Mortality Rate. As you can see from the numbers on the left and chart on the upper right, today shows a slight downtick (4/100%) of the M/R from yesterday’s reports.
The bottom graph shows the total U.S Fatalities. today’s numbers show a slight bend to the right indicating 251 fewer deaths than yesterday. Again, hopefully, this is a precursor to better numbers to follow…but no promises yet. We’ve seen the data bend back and forth and, as I’ve continued to note, one — or even two — days does not make a trend.

This chart is a “What If” graphic. It represents the M/R for reported infections. It also shows the M/R if we assume for each reported case of Wuhan Virus, there are 1, 2 or 3 other persons out there with it. For today’s report:
M/R = 1.75%
+1 = 0.87%
+2 = 0.58%
+3 = 0.44%
If you believe that there is a good chance that for each known person infected, there are 3 others out there who haven’t been reported, then the United States Wuhan Virus is still well below 1%.
We hope this is of some value. Whether it is or isn’t, please let me know in the comments.
Prayers for all the folks on the front lines of this effort who are putting themselves at risk on our behalf.
**Below is a snapshot of the Worldometers site showing their “as of” time of 2359


Join the conversation as a VIP Member