Absent a change in the outcome in Wisconsin or Michigan – but both are ripe for litigation given the late-night radical changes in numbers – the outcome is going to come down to whether Arizona changes, and if Pres. Trump’s margin in Pennsylvania withstands hijinks from Philly.
The advantage being piled up by Biden in Philly is massive – BUT, the numbers so far are not as massive as Philly was for Obama and Clinton. Biden’s share of the vote total in Philly is slightly less than was Clinton’s share, and it’s a decent amount less than was Obama’s share.
To compensate for that, Biden needs the overall number of votes from Philly to be up so that his larger share eats further into Pres. Trump’s cushion.
So, I took a look at some historical Philly records in terms of total voter registration, voter participation, and the share of the total participation won by the Democrat in each of the last 5 elections before yesterday.
The overall registration numbers come from this Pennsylvania government website, which reports voter registration by county in a very easy to use format.
The vote totals overall, and for Democrat candidates came from each Election year website on Wiki – no reason to believe those are not accurate, and they are set forth there by county.
Here are the total voter registration numbers for Philadelphia County in November of each election year:
Yr Reg. Voters
2000 1.025 mil
2004 1.062 mil
2008 1.126 mil
2012 1.099 mil
2016 1.103 mil
2020 1.129 mil
Next is the vote cast total each year and the voter participation percentage for each year.
Yr Total Votes Voter Participation
2000 561 k 54.7%
2004 674 k 60.9%
2008 717 k 63.7%
2012 690 k 62.8%
2016 709 k 64.3%
Next are the total votes cast for the Democrat and the percentage of all votes.
Yr Dem Votes Dem % Vote.
2000 449 k 80.0%
2004 542 k 80.4%
2008 596 k 83.0%
2012 589 k 85.2%
2016 584 k 82.5%
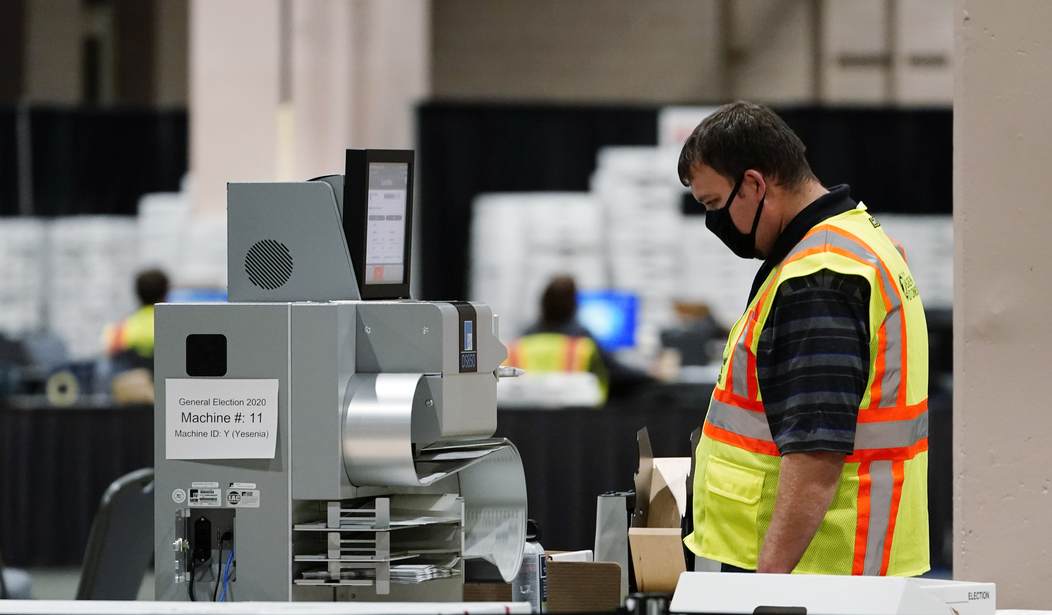
The current vote count for Biden out of Philly as reported by the NYT is 458,000 — which is 79% for Biden.
The total vote for the County is 570,000, with 70% of the vote estimated to be counted.
Another 30% would be roughly 175,000 votes on the high side. That would bring the total vote count for Philly to 743,000, or right at 66%.
As listed above, Philly participation has never gone above 64.3%, so 66% would be a record.
But let’s take a look at what higher numbers would resemble, and why those higher numbers would start to take on the markers of ballot fraud.
The following participation rates in Philly — based on the 2020 Voter Registration Number of 1.129 million voters — would produce the number of votes as follows:
65% = 735,000 votes.
70% = 790,000 votes.
75% = 847,000 votes
Biden is currently winning 79% of the Philly vote, which is underperforming Clinton and Obama.
If we increase his vote percentage to 85% — ahead of Clinton but right about the same as Obama’s best, the participation rates above would translate to the following in terms of Biden votes in Philly:
735,000 x 85% = 624,000
790,000 x 85% = 671,000
847,000 x 85% = 720,000
At 80% — which is where he’s at now according to the NYT — Biden gets the following number of votes with each of the voter participation rates (65, 70, and 75) listed above:
735,000 x 80% = 588,000
790,000 x 80% = 632,000
847,000 x 80% = 678,000
Hillary Clinton won 82% in Philly in 2016, and that equaled 585,000 votes.
Barack Obama’s best year in Philly was 2012 when he won 85% and that equaled 589,000 votes.
Voter participation in Clinton’s election was 64.3%.
Voter participation in Obama’s best year (2008) was 63.7%.
So 65% voter participation out of Philly would be better than either Clinton or Obama.
70% voter participation would be historically high for Philly.
75% participation in Philly, with Biden getting more than 85% of the votes, is just printing ballots in the names of people who have not voted, running them through the machine, and stealing the election.
When you look at the final figures out of Philadephia, anything involving a total vote of over 825,000, with Biden receiving more than 700,000 votes, is the Democrat political machine in Philly stealing the election by manufacturing votes.
I’m going to see if I can find similar data for Milwaukee and Detroit over the next few hours. Pennsylvania had easily accessible voter registration numbers which made the above analysis quite easy.


Join the conversation as a VIP Member