
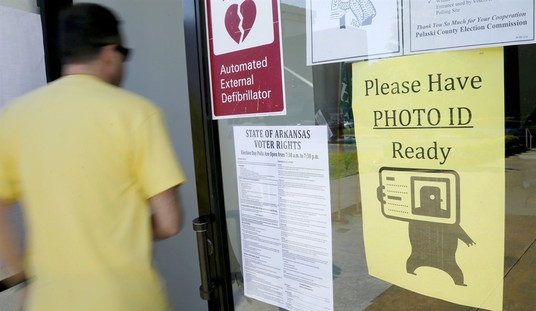
A lot of digital ink has already been spilled on the late September jobs report, which showed that a disappointing 144K jobs were added to payroll (versus an expected 180K). Deciphering what to make of each month’s job report has become a monthly game of political football that is designed (at least on the part of the Democrats) to confuse average voters into not knowing whether the economy is actually recovering or not. What to make of all the various ways the unemployment figure can be calculated? How do we assess the quality of jobs that have been added in this month versus the jobs that have been lost in previous months? Should we assume that the entire report should be evaluated just based on expectations? How do we properly account for people who no longer show up on the unemployment report because they have given up looking for work?
Via David Freddoso, this chart I think shows at least one simple way of examining the issue – how many people have gainful employment, as a percentage of overall United States population? As you can see, the numbers are not pretty.

Obviously, this graphic is at least somewhat simplistic in that it doesn’t account for a number of important variables including job quality, income, and job status. But it does illustrate in a helpful way what portion of the population is contributing in some way to overall productivity. And what it shows is that since the crash of 2008/09, there has been little or no meaningful improvement in the overall ratio of producers/non-producers. This of course is problematic because everyone who is not on the “working” side of this equation is supported in some way by tax dollars confiscated from those who are on the “working” side. The ratio was already unsustainable when employment was at 62-63%; at 59% we are careening towards disaster. And if 58-59% becomes the new normal, a lot of the gloomier projections about the sustainability of entitlement programs get a lot worse a lot faster.
Another thing this graph helpfully illustrates is that in terms of the real human impact of the recession, nothing the White House has done so far has worked to alleviate it. Almost exactly the same number of people as before are hurting and without work, despite roughly 7 dozen pivots to the economy, a ton of stimulus, and a severely misguided healthcare law. However the President wants to spin this, nothing he has done has worked.
Now, if I had my druthers, people would stop laying so much of the blame/credit for the state of the economy at the doorstep of the President; as a single person (even an important person), I think we are too prone to viewing the Presidency as having nearly magical ability to affect the economy. This, I suggest, is both unproven, incorrect, and a decidedly non-conservative way to look at how economies work. That is not to say that the President has no effect, just that we tend to overstate it. However, if ever there was a President who didn’t deserve to utilize this line of defense, it is President Obama, who deliberately fostered cult-like belief in his magical economic healing powers and rode them to victory in both 2008 and 2012. The evidence, however, has thus far shown that even if you accept that government can be the solution to our ongoing woes, President Obama does not know the right buttons to push to affect that change.


Join the conversation as a VIP Member