In 2008, Barack Obama won Michigan by more than 800,000 votes, a 6 percent jump from John Kerry’s performance in the state. His commanding victory included 46 of 83 counties and a 17 point margin of victory. The victory solidified Michigan as a “blue state” and caused it to be written off by many in the Republican party from that point forward. John McCain did very little campaigning in the Wolverine State, while Obama spent a great deal of time there.
In 2012, Mitt Romney committed more time to Michigan than was expected, but in large part, because his father was the Governor of Michigan from 1963 to 1969, after having been Chairman at AMC Motors for several years. (As a side note, AMC was based in Michigan but their major factory was in a little known town called Kenosha, Wisconsin.) Romney’s efforts there included numerous campaign stops and ad spending which earned Romney a significant jump in his share of voters in that race, which was largely attributed to his family’s history in the state.
Romney’s 2012 performance saw him outperform McCain by 4.89 points statewide, with some counties swinging to Romney by as much as 7 points. Again, much of this was attributed to Romney’s familial history in the state, and less to do with general attitudes about Republican and Democrat policies. What needs to be noted about that is that from 2010-2012 in Michigan, there was only a 2.45% increase in voters, adding 178,316.
In Michigan, people do not register according to party therefore it is harder for data-geeks like me to track the data, but, we get creative in our ability to extract meaningful conclusions from the data. For instance, in the Counties that Obama won in 2008 but lost to Romney in 2012, each county added an average of 455 voters between 2010 and 2012. In the Counties that McCain won in 2008 that Romney went on to win in 2012, it shows that 1200 voters on average were added to each of those counties. In other words, the counties that Obama lost in 2012, likely trailed in Democrat registrations and therefore began to lean further right than further left.
The New York Times put out a map from 2008 which shows that every single county in the state of Michigan shifted RIGHT in 2012, from 2008.
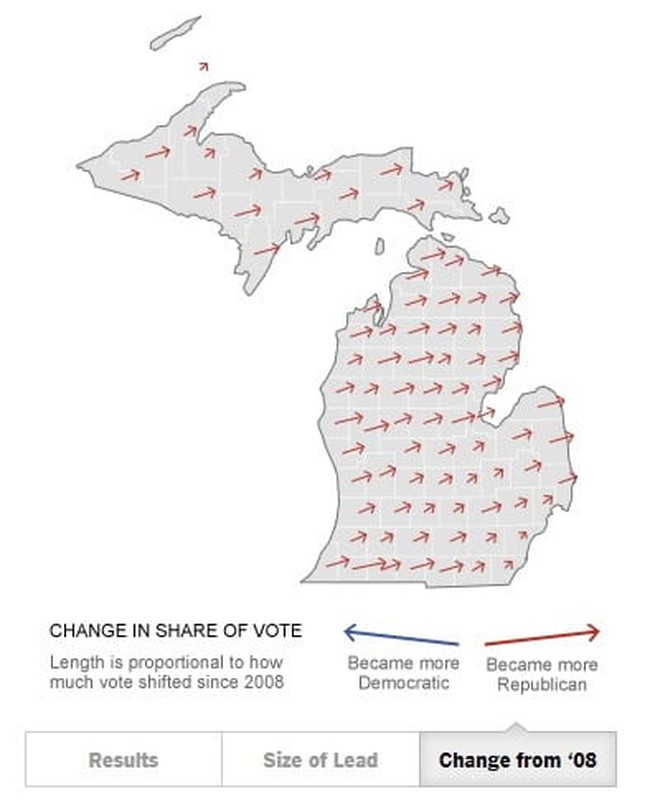
What this begins to tell us is that there’s a shift in voters towards the right, not towards the left. If we overlay this registration data on top of the returns from the Presidential elections, a trend emerges showing that the Republicans are actually winning over voters rather than a shift in candidate preference. To further highlight this shift, it is important to show that the shift continued into 2016.
Now, remember we were told that Romney’s Michigan performance was the result of his family’s history in the state. That would mean that in 2016, we could expect the counties that Romney won to shift back to Clinton or at the very least some of those counties would shift back. The issue is, not a single county that shifted from Obama to Romney in 2012, shifted back to Clinton in 2016. NOT ONE. In fact, Trump won 13 Counties that Obama won both in 2008 and 2012. Those counties not only have shifted, but shifted to Republicans favor by 14.06% over the course of 8 years, dwarfing any shift Obama had from 2004-2008. What this tells us is again, this isn’t a shift in candidate preference, but also a shift in voter party preference.
The voter data actually supports this shift. In 2012, in victory counties for Obama, voter registration fell by 0.03% compared to Romney victory counties that increased by 2.39%. While a 2.42% shift doesn’t meet the entirety of the shift, it shows that there’s a significant shift in voter registrations in those counties. If you just factor for the counties that Clinton won in 2016, that drop is 0.48% or a loss of 16,568 voters. Trump only won Michigan by just over 11,000 voters. In the counties that Trump won in 2016, voter registration increased 5.92%, factoring for a combined 6.4% shift in Trump’s favor. The state only had an average swing of 9.44% in favor of Trump in voting. The two are definitely correlated.
Which leaves us to our 2020 predictions. What is good though, is that in determining the trend from 2004/2008 until now, we can see that as more voters register in the counties that Romney and Trump won, the larger their share of voters they received in their respective election years. During the last 4 years, 81,809 voters have registered in counties won by Clinton in 2016. In Trump 2016 victory counties, voters have added 152,677 voters, or almost 2 to 1. Clinton counties have added 2.34% to their voter rolls while Trump counties have added 3.96% to theirs. If compared to 2012 and Obama and Romney’s victory counties, the data remains almost the same 2.56% for Obama counties compared to 4.18% in Romney counties. This means that unless Dems somehow stopped the tidal shift in Michigan, Romney/Trump counties are getting redder, while Obama/Clinton counties are shifting more Republican.
Again, this isn’t as exact of science as is party-registration like other states, but it definitely shows a correlation and tidal shift in registration and how it can potentially be related to how voters vote. My educated guess? Michigan goes Trump.