The planet's climate is vast and chaotic beyond our ability to easily understand; I've written and spoken about that for years. Perhaps even more so, the Earth's various cycles and events are also vast beyond our ken; just the forces unleashed in a hurricane, an earthquake, a tsunami, or a volcano make human efforts look awfully puny by comparison.
We do have tools, though, to try to improve our understanding of this natural world and all its systems, events, and cycles. One of those tools is statistical analysis, but anyone who has dabbled in statistics at all - I had to take two semesters of biostatistics in college, and still remember it with chagrin - knows that it's too easy to misapply.
Case in point: Watts Up With That's Charles Rotter has once more done some sterling work showing how a statistical outlier was not taken into account when analyzing temperature trends, and since the event that screwed things up was vulcanism, it ended up being a pretty startling screw-up - from a statistical standpoint.
A persistent assumption underlies modern global temperature reconstructions: that individual station errors, even when large, are diluted through spatial averaging and homogenization. That assumption deserves closer inspection. Recent analysis of station-level data suggests that under certain conditions—specifically when extreme outliers evade quality control and are subsequently incorporated into homogenization routines—localized anomalies can propagate nonlinearly through the global record.
The present investigation began with a routine audit of tropical station residuals within the GHCN (Global Historical Climatology Network) dataset. The initial objective was unremarkable: quantify the distribution of post-homogenization adjustments across low-latitude stations. What emerged instead was a persistent and statistically anomalous signal centered on a single station in Costa Rica, hereafter designated CR-VOLC-EL-INFIERNO-01.
To put that in simple English, a review of the data was conducted to identify the station errors mentioned. But they found a problem in the data, and it was, as we might expect, due to volcanic activity.
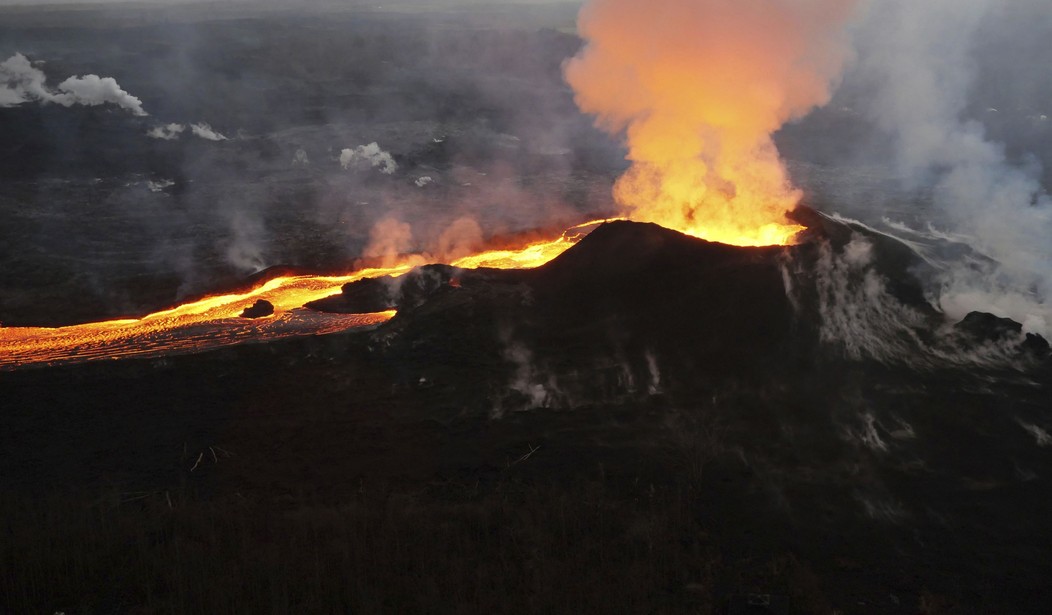
The anomaly first appears in the late 1970s, coinciding with documented volcanic activity in the Talamanca Range. At face value, elevated temperatures in proximity to geothermal activity are not unexpected. What is unexpected is the magnitude, persistence, and downstream influence of those readings once introduced into the global processing pipeline.
Raw observations from CR-VOLC-EL-INFIERNO-01 indicate sustained daily maximum temperatures exceeding 300°C over multiple reporting intervals. Such values would ordinarily trigger immediate exclusion under standard quality control thresholds. Yet archival flags associated with this station indicate no such exclusion occurred. Instead, the readings were retained and subjected to standard homogenization procedures.
The Cordillera de Talamanca is a range of mountains in southeast Costa Rica and western Panama.
Read More: Blotting Out the Sun? What Could Possibly Go Wrong?
New Ice Core Study Shows Moderate Warming Happens Every Few Centuries
The range doesn't contain any super-volcanoes like the Yellowstone caldera, or even Mt. St. Helens - but it does include at least two volcanic peaks capable of screwing up local temperature readings, those being the El Viejo volcano in the southern part of the mountains, and the Volcán Barú in western Panama. Of the two, it looks like the second is more active.
Here's where things get complicated; this ends up being a systemic problem, not a local one. Mr. Rotter continues:
To quantify the global impact, a sensitivity analysis was conducted. Two reconstructions were produced:
- A standard reconstruction including all stations.
- A modified reconstruction excluding CR-VOLC-EL-INFIERNO-01.
The results are instructive.
In the standard reconstruction, global mean temperature anomalies show an increase of approximately 0.9°C from 1975 to present. In the modified reconstruction, the increase is reduced to approximately 0.02°C over the same period.
Here's the graph:
— Ward Clark (@TheGreatLander) April 1, 2026
Complicated? Yes, but these things tend to be complicated. We are assessing trends over much of a planet, after all - and most such studies are intended to evaluate human impact, not volcanoes.
So, if you'll return your seat backs and tray tables to the upright and locked position, we'll bring this sucker in for a landing.
First: These volcanoes are, as such things go, small. Neither is the size of Italy's Vesuvius, nor Mount Tambora in Indonesia. But they still were big enough, and compared to human activities, they were overwhelming. That's generally the way things are when we compare our activities with natural events. Just look up at the sky on a clear day, and you'll see a big, shiny thing that has more impact on Earth's climate than we could ever hope to exert.
Second: Any statistical analysis is only as good as its presumptions. For any such analysis, one has to know all the inputs, and more to the point, has to account for all the variables. Garbage-in, garbage-out applies.
Third: The climate scolds do none of these things. Here, Mr. Rotter uncovers a flaw in a statistical model, and he does something that the climate scolds never do: He changes the presumptions, adjusts the model, and tries again. Climate scolds rarely, if ever, correct their own work. Science works this way, but the climate scolds do not.
That's the key thing to remember about these people. They claim to "freaking love science," but their work is anti-scientific. They don't pretend to try to understand the planet's vast cycles or its billions of years of history. Their goal is a political one, not a scientific one, and we forget that at our peril.