In cultural news, here’s a notable change.
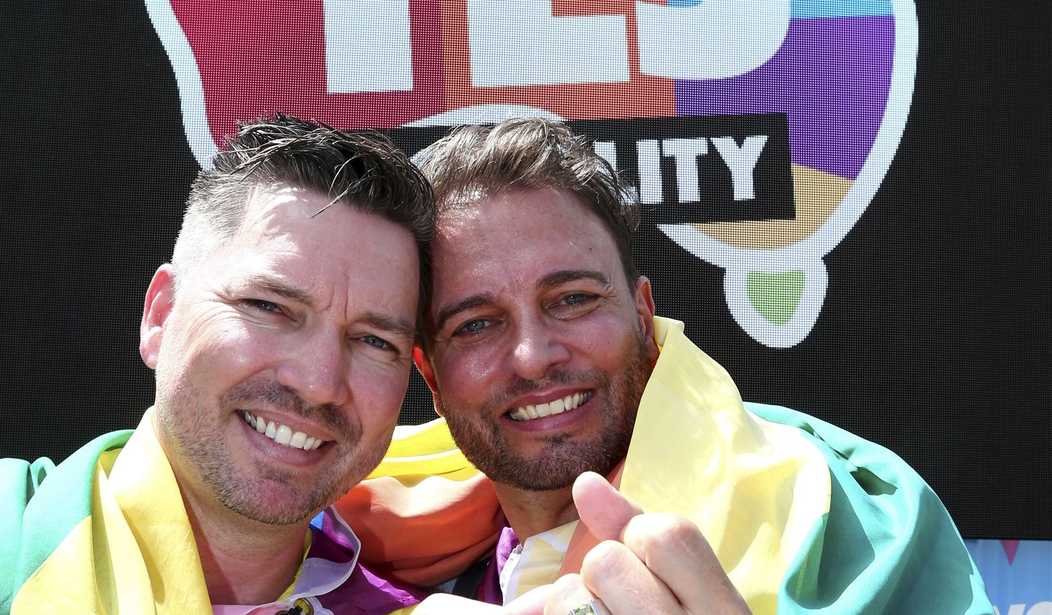
According to a Public Religion Research Institute poll, a majority of Republicans now support same-sex marriage.
It’s a slim majority — just 51% — but it certainly indicates an evolution of American attitude.
Per the report, 2019 had turned out a 47% favorability among the party of Reagan and Trump — if one might consider that the same party.
The study — whose results were released Tuesday — surveyed 50,334 Americans by way of bilingual telephone communication between January 7th and December 20th of last year.
Participants were asked their views on three LGBT issues:
- Same-Sex Marriage
- Non-Discrimination Laws
- Service Refusal by Companies
Of those three categories, PRRI relays, “Only one in five Americans show unfavorable opinions toward LGBTQ…on at least two of the three questions.”
Those “completely against” total 7%, while 13% are “in the somewhat against category.”
Here’s more:
By contrast, the majority of Americans show favorable opinions (69%), including more than four in ten Americans (42%) who completely favor pro-LGBTQ policies and 27% who somewhat favor them. Finally, 11% of Americans declined to answer or said they did not know their opinion on one or more of the three policies.
Perhaps unsurprisingly, those determined to be “completely against pro-LGBTQ policies” are “older, more likely to be Republicans, feel more favorably toward former President Donald Trump, and are more likely to be white and white Christian than the American population and those who are in favor of these pro-LGBT policies.”
As you may know, not only is LGBT support increasing, but so is the alliance’s membership numbers.
Earlier this month, RedState’s Brandon Morse covered a recent Gallup poll indicating such.
Brandon quoted The American Spectator:
The age difference is stark: while only 2 percent of Baby boomers identify as LGBT, that number increases to 15.9 percent — nearly one in six — among Gen Z adults, which includes people ages 18 to 23. Similarly, political affiliation has a strong correlation to LGBT identity. Thirteen percent of liberals identify as LGBT, while only 2.3 percent of conservatives do.
…
30.7 percent of Gen Z liberal adults, those born from 1997 to 2002, identify as LGBT, Gallup told The American Spectator. This finding has a margin of error of +/- 6 percent.
Meanwhile, 6.6 percent of Gen Z conservative adults identify as LGBT.
Back to PRRI’s same-sex marriage stats, the organization notes LGBT support has reached a record peak among independents, too: Those with no party affiliation score 72%, up from the mid-60’s of the past few years.
At 76%, Democratic support for gay marriage is actually down from 2018’s 77%.
Still, it’s up from 2019’s 70%.
Overall, according to the poll — 75% of Americans now support “LGBTQ Nondiscrimination Protections.”
As for the nation’s Christian community, the numbers are as follows:
Among all Americans who identify as evangelical or born again, there are significant differences by race and ethnicity. Black evangelical Protestants (70%) and other evangelical Protestants of color (66%) are more likely than white evangelical Protestants (62%) and Hispanic evangelical Protestants (62%) to favor nondiscrimination protections for LGBT Americans.
Younger members of religious groups who are under age 50 are more likely than their older counterparts to favor LGBT nondiscrimination laws. The gap is larger among white evangelical Protestants (73% of those under age 50, 56% of those over age 50), other Protestants of color (80% of those under age 50, 61% of those over age 50), Black Protestants (80% of those under age 50, 66% of those over age 50), and white mainline Protestants (88% of those under age 50, 75% of those over age 50). The gap is around eleven percentage points or less among white Catholics (83% of those under age 50, 72% of those over age 50), Hispanic Protestants (71% of those under age 50, 62% of those over age 50), Hispanic Catholics (84% of those under age 50, 75% of those over age 50), and religiously unaffiliated Americans (86% of those under age 50, 76% of those over age 50).
I may be wrong, but it seems society is transitioning at a faster pace than ever before in modern history.
From 2010 to 2020, for example, I’d say there was much, much greater change than between 1990 and 2000.
Am I right? If so, what’s the impetus of our accelerated rate?
Either way, we’re peering into the future. And it’s a much different one than our grandparents might’ve ever imagined.
-ALEX
See more pieces from me:
Making History: Illinois City Becomes the First in America to Pay Reparations to Black Residents
Find all my RedState work here.
Thank you for reading! Please sound off in the Comments section below.


Join the conversation as a VIP Member