
Net Neutrality is 2017’s y2k freak-out for too many interwebs surfers, and if you’re prone to mob driven bouts of outrage then you’ve likely taken to social media with the rest of your pack and howled into the night sky with rage over Net Neutrality’s repeal.
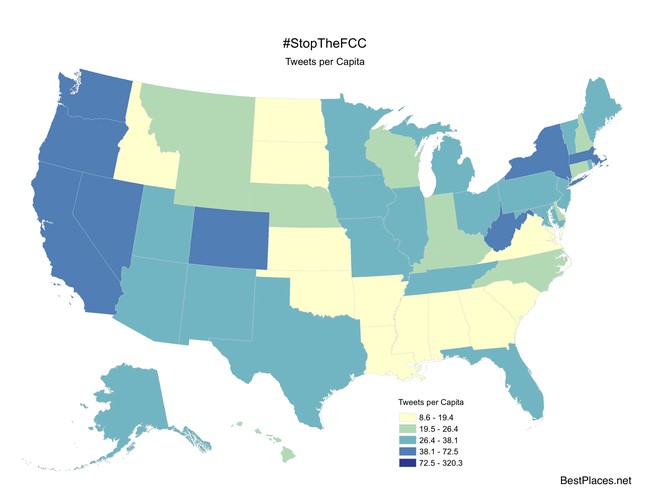
Bertrand Sperling, a company that keeps track of demographic data, analyzed 145,000 tweets using the popular hashtag #StopTheFCC. After the compiling the locations of where these tweets originated, we can see where the anti-FCC tweets were primarily concentrated.
| 1 | District of Columbia | 320.33 | 1872 | 584,400 |
| 2 | West Virginia | 72.52 | 1335 | 1,840,802 |
| 3 | Oregon | 56.83 | 2138 | 3,761,925 |
| 4 | Massachusetts | 50.36 | 3262 | 6,477,096 |
| 5 | New York | 49.28 | 9477 | 19,229,752 |
| 6 | Colorado | 44.91 | 2195 | 4,887,061 |
| 7 | Nevada | 43.03 | 1133 | 2,633,331 |
| 8 | Washington | 42.70 | 2802 | 6,561,297 |
| 9 | California | 41.95 | 15370 | 36,637,290 |
| 10 | Vermont | 38.13 | 238 | 624,258 |
While not surprising, it’s interesting that the highest anti-FCC tweeting per Capita came from the smallest area, Washington D.C., with over four times more outrage than its runner up, West Virginia. From West Virginia on down the list, the amount of tweets have more of a subtle difference.
Why our nation’s capitol would have such a huge concentration of tweets calling for the stoppage of government control over the world’s largest communications network is anyone’s guess.
The overall map shows that the highest concentration came from coastal areas with the exception of the south eastern states. Those not on the coasts are states with a lot of Democratic voters and politicians. West Virginia, a red state, seems to be the exception. While states like Texas are blood red, the larger cities suffer from a blue shade. Combine this with the California migrants in places like Austin and Dallas, and you’re probably going to see a lot of outrage tweets be generated.


Join the conversation as a VIP Member