
The ChiCom virus-related dichotomy of state public health guidelines persist. For all practical purposes, Red states are open for business while Blue states continue draconian mask mandates and policies that are inching toward the issuance of vaccine passports. Vaccine passports are the 21st-century mark of the Devil, in my opinion. If the Democrats and other assorted authoritarian leftists have their way, that “mark” would be a requirement for buying and selling, traveling, and employment.
Except that ChiCom virus statistics as reported by the Centers for Disease Control are “providing the science” to back up those Blue state policies. Never mind the economic positives in states like Florida, Texas, and South Dakota:
Here are some CDC graphics that won’t be shown or discussed on CNN or MSNBC any time soon. The first is a graph showing new virus cases in the US over the 7-day period ending 7 May:
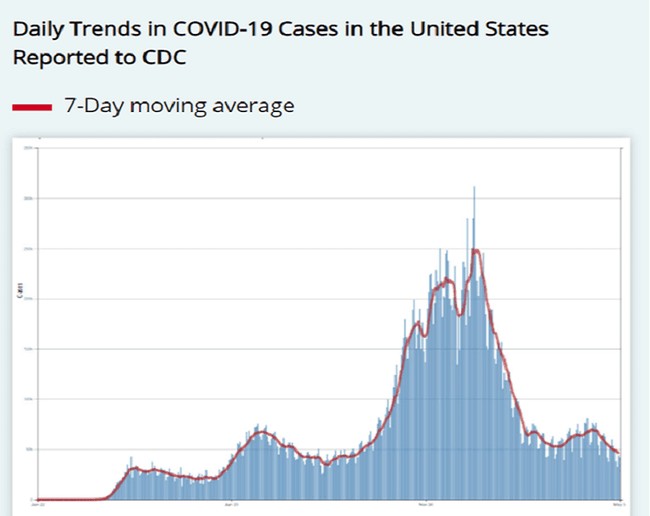
While the graphical representation is illuminating, the CDC’s commentary is even better:
The current 7-day moving average of daily new cases (45,817) decreased 13.2% compared with the previous 7-day moving average (52,772). Compared with the highest peak on January 8, 2021 (249,672), the current 7-day average decreased 81.6%.
The decrease in hospitalization cases is excellent, too:
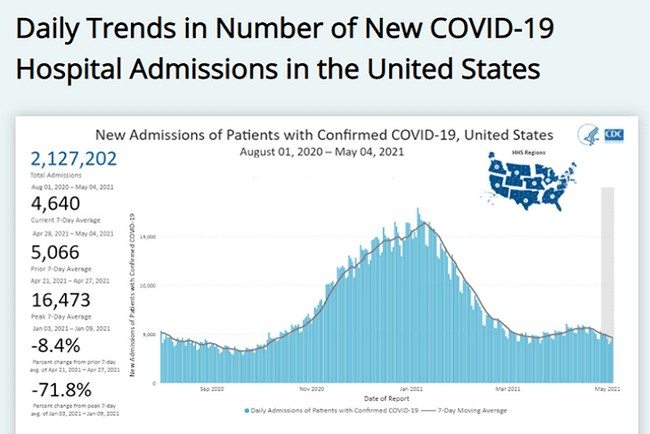
Down, down, down, just as the CDC says:
The current 7-day [hospitalizations] average for April 28–May 4 was 4,640. This is an 8.4% decrease from the prior 7-day average (5,066) from April 21–April 27. The 7-day moving average for new admissions has been consistently decreasing since April 19.
Virus deaths nationwide have been trending downward since January, too:
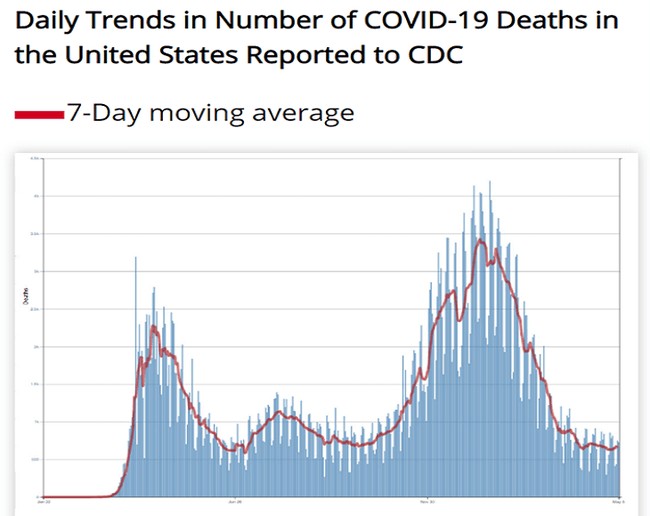
Never mind the continuing controversy surrounding death statistics that report people who died WITH the virus versus those who died BECAUSE of the virus. Deaths are heading downward, in any event.
Now let’s look at influenza numbers. Here is how one expert describes a normal flu season:
Although there are regional differences, cases of the flu begin to pick up around October, peak in December through February, and can last until May, says Natasha Bhuyan, MD, an infectious disease specialist and family physician in Phoenix, Arizona.
And here are the CDC’s statistics for influenza in 2020-2021, which indeed follow that seasonal pattern:
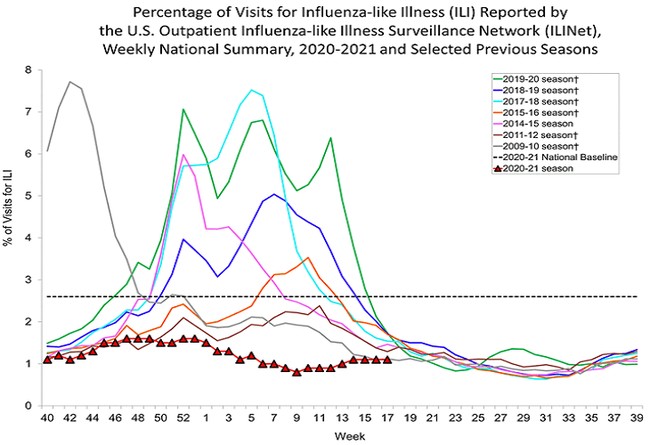
Note the historically low numbers for influenza this year compared to prior years. Why might that be the case? Given that the ChiCom virus and influenza are respiratory illnesses, has the line been purposely blurred between the CDC’s reporting of statistics for each virus? You decide.
Here we are in the middle of May, and the ChiCom virus-related statistics are following a traditional flu seasonal pattern. Is that just a coincidence, or is that the science shouting to us in a loud and clear voice that FLU SEASON IS OVER? (And that includes that other respiratory illness called “COVID-19,” too!) These numbers and graphs should be on the front page of every newspaper and triumphantly repeated on network news broadcasts. That they aren’t is a clear indication of the political agenda behind those who wish to keep the economy and people in general locked down and cowering with fear – Democrats and ChiComs. Gotta pass that big infrastructure boondoggle, don’t ya know, and whatever other spending bonanza that will skyrocket inflation.
Are you going to believe the flipflopping Dr. Fauci, the darling of the legacy media airwaves and purveyor of doom and gloom, or your own eyes?
The end.