
Weeks of increasingly apocalyptic statements by CDC Director Dr. Rochelle Walensky as well as Dr. Anthony Fauci, accompanied by little to no evidence, finally came to a head in the last few days. Their concerns and statements regarding the Delta variant of COVID-19, coupled with reversing health policy and guidance, were finally met with calls to see the data leading to these conclusions. On Tuesday, Dr. Walensky made a statement urging a return to mitigation by masking, citing data – which she did not cite or release at the time – that the Delta variant resulted in a higher viral load, more severe disease than the original strain, and caused vaccinated individuals to be just as infectious as the unvaccinated.
Late last night, the internal CDC slide deck, including the source material for these new determinations, was leaked. Most of the slides focus on vaccine effectiveness, with only seven slides examining the new data on the Delta variant – presumably the data the CDC had used to reverse course on mitigation. Of these seven slides, one is a comparison of transmissibility between the Delta variant and ancestral strains on one hand, and a variety of other infectious diseases of various and broad transmission types on the other. Two of the slides cover an internal model the CDC has generated attempting to predict future Delta transmission rates and the effect of masking and vaccines on those rates.
Of the four remaining slides I am going to give a quick review of the sources and data on three of them: slides 16-18. For these three slides, five data sources are cited, as well as two more that seem to remain uncited – though we can infer at least one of the sources of data here. Of the five cited sources, one is peer-reviewed and published, one is a UK government document that has been well-known for a week, two are pre-prints (not yet reviewed), and the last has been rejected from an initial review. It’s important to note that pre-prints have been useful in several ways, but ever since last year, there have been many concerns raised about how quickly they can spread bad data and misinformation.
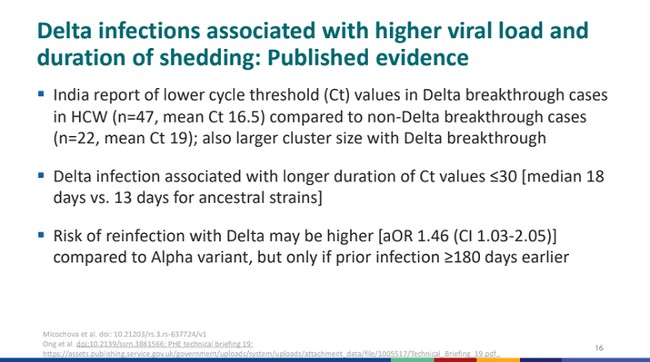
CDC slide 16, statement 1: India report of lower cycle threshold (Ct) values in Delta breakthrough cases in HCW (n=47, mean Ct 16.5) compared to non-Delta breakthrough cases (n=22, mean Ct 19); also larger cluster size with Delta breakthrough
This comes from one study that has already gotten a lot of attention in the last few days after it was assumed to be one of the sources involved in the CDC’s decision-making. The India Report, as labeled by the CDC here, has already been – rightly – criticized for several damning failures: first and foremost being that it was rejected by peer review. Out of all the studies, it also must be the most convoluted, poorly written, and confusing – and that might even be what the CDC is banking on here by citing it. Upon review, it looks as if the study is not one, but three, all squished into one paper. This includes a computational model, an epidemiological study on healthcare workers, and a biological study on neutralizing titers. What the CDC seems to be concerned with are the last two, so I’ll focus on that. The study follows a small sample of ChAdOx1 (AstraZeneca) and Pfizer/BioNTech vaccine recipients – without mentioning either how small the sample is or the divergent vaccination.
“We obtained similar data on breakthrough infections and ChadOx-1 [sic] vaccination status in two other health facilities in Delhi with 4000 and 1100 HCW staff members respectively (Figure 2D). In hospital two there were 51 such sequences from 70 symptomatic infections for which reconstructed phylogenies from 57 with high-quality whole genome coverage; in hospital three there were 118 symptomatic infections documented, with 57 used for reconstruction of phylogenies.”
Later, the paper compares how Delta reacts to both AstraZeneca and Pfizer (for both one and two doses) vaccines and shows that the Pfizer vaccine holds up against Delta at much better rates than AstraZeneca. The CDC did not cite this information and the information they did cite correlated with the above excerpt following only the AstraZeneca outcomes – a vaccine that is not used in the United States. Therefore, it is incredibly difficult to see how the cited information by the CDC can be extrapolated to the US vaccination and health situation. Also, it becomes very hard to take a paper riddled with spelling errors and incredibly messy composition seriously as a basis to direct the lives of around 330 million people half a world away.
CDC slide 16, statement 3: Risk of reinfection with Delta may be higher [aOR 1.46 (CI 1.03-2.05)] compared to Alpha variant, but only if prior infection ≥180 days earlier
The third data point on this slide – don’t worry, I’m intentionally skipping the second one for a moment – is a snippet of information from page 35 of a Public Health England technical briefing from a week ago. This section, numbered 1.7.1, covers national surveillance of reinfections. It has a healthy sample size of 83,197, and the models were adjusted for “age, sex, region of residence, vaccination status (either any vaccine within the last 14 days or no vaccine), ethnicity, and week of test.” The model also included the variable the CDC seems interested in – whether a person had a natural infection (infection as confirmed by a positive test) more or less than 180 days ago. Of all the people tested, 980 were identified as potential reinfections (1.2%).
The information above uses an odds ratio to determine the risk of reinfection for Delta and shows some evidence that those who had previously been infected with COVID-19 more than 180 days ago were slightly more likely to be reinfected (the odds ratio, not included above, for previous infection under 179 days was 0.79, 95% Cl 0.49 to 1.28. Important to note: an odds ratio below 1 means something is less likely, an odds ratio above 1 means something is more likely). It’s also important to note that it doesn’t seem that this information accounts for variations in vaccines – while mRNA vaccines are dominant in the US (J&J use is negligible), the UK has approved both mRNA vaccines as well as two viral-vector vaccines – AstraZeneca and Janssen. So, it’s unknown how well this translates to the US – mostly mRNA – situation.
CDC slide 16, statement 2: Delta infection associated with longer duration of Ct values ≤30 [median 18 days vs. 13 days for ancestral strains]
I initially skipped this second data point because the same study is used as a reference for slide 18, and I would like to cover it all at once:
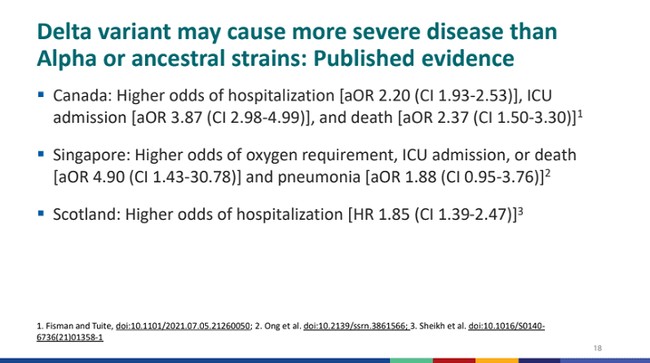
CDC Slide 18, statement 2: Singapore: Higher odds of oxygen requirement, ICU admission, or death [aOR 4.90 (CI 1.43-30.78)] and pneumonia [aOR 1.88 (CI 0.95-3.76)]2
This is the pre-print Singapore study. There are several issues with this study and how well it relates to the health policy and situation of the US. First, the study suffers from a very small sample size of only 829 patients being monitored – either with Alpha, Beta, or Delta infections (here referred to as VOCs). Also, important here is to note that these were all the VOC infections in all of Singapore during the time the study covered. This cohort was compared to 846 consecutively admitted patients with other strains of COVID-19 (non-VOC). Of the 829 individuals testing positive for VOCs, 157 were admitted. These 157 cases are then compared to the 829 original COVID-19 cases to create odds ratios for treatment types and death. I highly recommend going to Table 2 to see all comparisons of treatment, admittance, and outcomes between the data sets.
CDC slide 18, statement 1: Canada: Higher odds of hospitalization [aOR 2.20 (CI 1.93-2.53)], ICU admission [aOR 3.87 (CI 2.98-4.99)], and death [aOR 2.37 (CI 1.50-3.30)]1
This study, probably the strongest of all the cited data, comes from Canada and is also a pre-print. The study has a robust sample size, and it controls for various health-related and demographic variables. The main limitation of this study is that though it models for vaccinations, this is general, and an indirect overlay on the accumulated data. The study acknowledges its one area of significant weakness:
“Canada is now one of the most widely vaccinated countries in the world with respect to SARS-CoV-2, and vaccination has undoubtedly blunted the impact of emergence of these VOCs. A key limitation of our dataset is that it lacks data on individual-level vaccination status. We are indirectly modeling the impact of vaccination for prevention of severe illness by incorporating a linear trend term in our model.”
Due to the similarities in demographics, geography, lifestyle, and vaccine types in use between Canada and the USA, this might be the most relevant and strong data set of all the sources. It does show evidence that this variant could hit younger adults much harder than the original.
CDC slide 18, statement 3: Scotland: Higher odds of hospitalization [HR 1.85 (CI 1.39-2.47)]3
The final citation comes from Scotland and is the only peer-reviewed and published source. This is also a good study, but the interesting parts are what the CDC chose not to include. The summary of the publication goes:
“In summary, we show that the Delta VOC in Scotland was found mainly in younger, more affluent groups. Risk of COVID-19 hospital admission was approximately doubled in those with the Delta VOC when compared to the Alpha VOC, with risk of admission particularly increased in those with five or more relevant comorbidities. Both the Oxford–AstraZeneca and Pfizer–BioNTech COVID-19 vaccines were effective in reducing the risk of SARS-CoV-2 infection and COVID-19 hospitalization in people with the Delta VOC, but these effects on infection appeared to be diminished when compared to those with the Alpha VOC. We had insufficient numbers of hospital admissions to compare between vaccines in this respect. The Oxford–AstraZeneca vaccine appeared less effective than the Pfizer–BioNTech vaccine in preventing SARS-CoV-2 infection in those with the Delta VOC.”
Finally, I’d like to quickly comment on the two data points on slide 17 neither of which, as of this reading of the slides, includes links to the data.
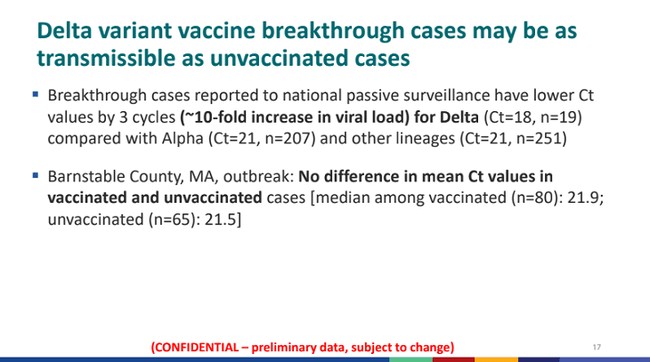
The first statement, most likely coming from COVID-NET data, is an incredibly small sample. There are only 19 Delta breakthrough cases even being looked at here, compared to over 200 for both the Alpha and various other variants.
The second data point comes from a small outbreak cluster in Massachusetts and is found in a report the CDC just released this morning. This report shows that the breakthrough cases are more likely to be Delta, not that Delta has a stronger propensity to be a breakthrough. Since Delta is evolutionarily fitter than its competitors, it may be more present in the composition of circulating variants, and consequently account for more breakthrough cases. Equally, the study lacks even the most rudimentary of statistical significance analyses – for instance, it is noted that vaccinated individuals had a higher cycle threshold (and consequently lower viral load) than their unvaccinated counterparts, but the difference is quite small, and no measure of statistical significance is given. Without significance testing, the relevance of such mere findings is hard to ascertain.
I’m reminded of a different life, ages ago, when a statistics professor of mine made the statement “Statistics don’t lie, but statisticians do.” The CDC might not be lying, but its exaggeration of the data and its relevance to the US health situation certainly borders uncomfortably close on deceit. The picture the CDC seeks to paint is that its whiplash-inducing U-turn over the last week was the result of sound scientific evidence – but the evidence is neither extensive nor does it unanimously point towards what the CDC cherry-picked from it (without, of course, mentioning as caveats the reasons why those pieces of evidence might not apply to the current situation. The data, quite simply, does not support the bold assertions of the CDC. There are perhaps two findings that support an increased risk for young adults with fewer or no comorbidities from Delta, and some evidence suggesting that, and that Delta might be slightly more infectious.
What the data shows is that – contrary to the CDC’s clumsy messaging – vaccines work, and while this new increased risk to young adults should encourage vaccinations among that age group, there is no need to advocate for extreme mitigation based on overstated evidence and exaggerated risks.


Join the conversation as a VIP Member