
Election irregularities in the 2020 presidential election continue to be uncovered through independent analysis. An expert team led by physicist and Mensa John Droz, Jr., has been relentlessly examining election-related data and lawsuits since November, uncovering significant anomalies that warrant further investigation. The team’s objective throughout has been to help ascertain that all legal votes – and only legal votes – were counted. These efforts were previously reported out here, here, and here.
The team has just completed a “contrast analysis” of Biden versus Trump results in 2020 and Trump versus Clinton results in 2016 that exposes some irregularities that cannot be easily explained. An example from the report is provided below that explains what a contrast analysis is:
[I]n California, Biden beat Trump by 5± million votes (2020), whereas Clinton beat Trump by 4± million (2016). Doing the arithmetic, the contrast is 833,843 votes. (Statisticians call this the Difference of the Differences, or DoD.) Note that Trump increased his California vote total [from 2016 to 2020] by 1.5± million votes. However, Biden increased the Democrat candidate’s vote total by 2.3± million [from 2016]. Where did California find 3.8± million more votes in 2020 than in 2016? Easy, you say: California’s population has increased.
That’s a good thought, but between 2016 and 2020, the Census Bureau says that the population of California increase by less than 700,000 people. (Note that this includes children not old enough to vote, non-citizens, non-registered citizens, etc.). However, as mentioned above, the 2020 vote total for the Democrat candidate increased by 2.3± million votes. On the face of it, that significant vote increase does not appear to be logically explainable.
In fact, one logical explanation for the contrast would be that President Trump’s 1.5± million increase in vote totals from 2016 to 2020 came from people who voted for Hillary Clinton in 2016 or who sat out the 2016 election. Where could Biden’s 2.3± million increase over Clinton’s total in 2016 have come from? Note: as the team reports, “A statistical contrast is not proof of voting fraud, but a large contrast does point to situations that might merit closer examination.” And that is exactly the purpose of the team’s contrast analysis: to identify states in which vote tabulations could warrant further analysis, peeling the onion to the county and precinct levels as appropriate in order to forensically validate the results.
In order to complete the contrast analysis, the team compiled voting statistics by state for the 2016 and 2020 elections (available here), including the number of registered voters and votes cast for individual candidates. From the data, the team was able to gather some insights on voter turnout rates:
In prior Presidential elections, the highest state voter turnout in the country was: 2016 = 75%, 2012 = 76%, 2008 = 78%, and 2004 = 79%
Based on [the above] historical data, any state showing a Presidential turnout rate in excess of 80% should be considered suspect.
Of the top 10 states with the highest 2020 voter turnout rates, the top five in population all went for Biden.
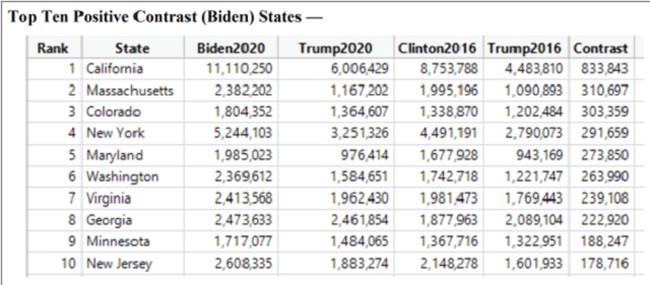
The team performed contrast analyses for 48 states (Alaska and Maine were not examined due to lack of data), with a positive contrast indicating that Biden scored more votes in 2020 than expected in that state, and with a negative contrast indicating that Trump did better in 2020 than expected. The team also performed a contrast analysis for each county in each state in order to determine outliers that are good candidates for precinct-level analysis. Several outlier states were identified in which the positive contrasts for Biden could not be easily explained by population increases in those states. In addition, the ten states with the largest positive contrasts provided 3± million more votes for Biden than they did for Clinton, as shown in the table below. Is that really possible without fraud, given Biden’s unwillingness to campaign and inability to draw a crowd when he did?
Here are some other observations from the contrast analyses performed by the team:
- Massachusetts generated 310,000± more votes for Biden than expected. Massachusetts gained population (165,000±) from 2016 to 2010, so every new registered voter citizen (assuming all new residents were of voting age!) plus about 190,000 previous citizens would have had to vote for Biden – a highly unlikely occurrence.
- Trump carried Georgia in 2016, yet lost in 2020 while gaining 372,000 votes partly because Biden got 220,000± more votes than expected. Where did those Biden votes come from since the state only gained 425,000 residents from 2016 (not all of voting age)?
- Trump did better than expected in Ohio and Florida while also improving over 2016 in Louisiana, Alabama, and Utah, each of which counted their absentee ballots BEFORE Election Day (no counting of absentee votes afterward). In other words, whatever transpired during “the Great Pause” in counting “new” Biden votes was precluded from happening in those five states. Is that just a coincidence?
- New York lost over 304,000 residents from 2016 to 2020, yet the state provided approximately 300,000 more votes for Biden in 2020 than expected. How is that possible when Trump increased his vote totals in 2020 by over 461,000 from 2016?
- Other Deep Blue states like Illinois, Connecticut, and Hawaii lost population from 2016 to 2020 but increased the vote margin for Biden substantially over Clinton’s numbers in 2016. That cannot be easily explained. Was Biden really that much more popular than Hillary Clinton?
- New York, New Jersey, and Illinois lost population from 2016 to 2020, but dramatically gained in voter registrations. How likely is that?
- Michigan and Pennsylvania gained slightly in population from 2016 to 2020, but gained dramatically in registrations. That seems highly unlikely.
- California gained 700,000± in population from 2016 to 2020, but gained 6,000,000± registered voters. Not bloody likely no matter how big of a voter registration drive there was.
- Among the top ten positive contrast states (i.e., where Biden did better than Clinton did in 2016), California, Massachusetts, Minnesota, New York, and Washington all had protracted vote counting/tabulation due to laws preventing the count of mail-in before the polls closed. Those states plus Virginia also allowed absentee ballots to be postmarked on Election Day. Three other states (Colorado, Georgia, and New Jersey) extended the deadline for receipt of absentee ballots up to the time the polls closed on Election Day. In short, ALL of the top states where Biden picked up significant votes from 2016 in some way relaxed the voting regulations before the 2020 election.
Conclusion. This latest report from the Droz team adds more fuel to the fire regarding “election irregularities” in multiple states during the 2020 presidential election. Be sure to read the whole report here. It is a travesty that forensic audits are not being conducted in many states to validate the results. That the Democrats have fought tooth-and-nail to prevent such audits explains much because if they were certain of Biden’s “overwhelming victory,” then the audits would prove that fact once and for all. Thank God that independent analysts like the Droz team are continuing to dig into the 2020 election data. The American people need to know what happened, and integrity in elections needs to be restored through decisive actions to tighten up state election laws.