

It’s been just over a month since I last updated Missouri’s COVID numbers here — and it’s been an erratic one at that. There was the single-day gargantuan leap in reported tests (from September 30 to October 1, Missouri reported (per Worldometers) an increase in tests of — get this — 564,236!) followed by the four days last week when the DHSS website/COVID dashboard was down due to a “database extraction error“. The headlines from the Post Dispatch (and other local news sources) of late have been all about how we’re hitting record-high numbers of new cases and hospitalizations and renewed lockdowns may be coming. So…what do the numbers actually say?
Over the past month (again, per Worldometers), Missouri has jumped up another three spots in reported cases (from 20th to 17th), with a total number of reported cases as of this morning (October 20th) of 165,242, (up by 56,231 since September 17th. Again, up until July, Missouri had been hovering fairly consistently around the 29th spot.) Missouri now has 26,924 cases per million persons (up from 17,762), which places it 21st among the 50 states & DC (up eight spots from a month ago.)
There have now been 2,691 deaths in Missouri attributed to COVID-19. That’s up from 1,878 on September 17th (so by 813) and Missouri has now moved up into 23rd place in terms of total (reported) COVID-related deaths. In terms of deaths per million, Missouri now sits at 438 (up from 306 one month ago) and has moved up six spots into 26th place.
Regarding testing, here is where the numbers have really changed (and I’ve yet to see an explanation for the significant jump): Missouri has now reported 2,406,589 tests administered (up from 1,236,051 a month ago), which moves it up into 19th place in total tests. As for tests per million persons, Missouri has administered 392,117, which moves it up twenty-two spots to 21st.
Hospitalizations have increased over the past month. The last reported data per the Missouri Department of Health and Senior Services dashboard is 1439 as of October 16th. (We were at 989 on September 13th.) Nevertheless, per DHSS, remaining total hospital bed capacity is 42%, remaining ICU bed capacity is 29%, and remaining ventilator capacity is 67%.
In sum, while the total number of reported cases of — and deaths attributed to — COVID-19 have increased measurably, and Missouri has moved up relative to other states in all of the categories tracked by Worldometers, we have not seen a spike the way Florida, Texas, and Arizona did earlier in the summer. (In fact, the rate of increase in reported cases has averaged 1.2% over the past 30 days. For the previous 30 days, it was 1.6%. ) Where we did see a spike was in total tests. Again, I’ve not seen an explanation for that, but I’ll take it — I’d rather see those numbers spiking than reported cases or, even worse, deaths.
As before, I’m including a chart of what Missouri’s numbers look like — you’ll note that whacky gray spike on October 1 (and another smaller one on October 11, when 78,414 tests were reported in one day.)
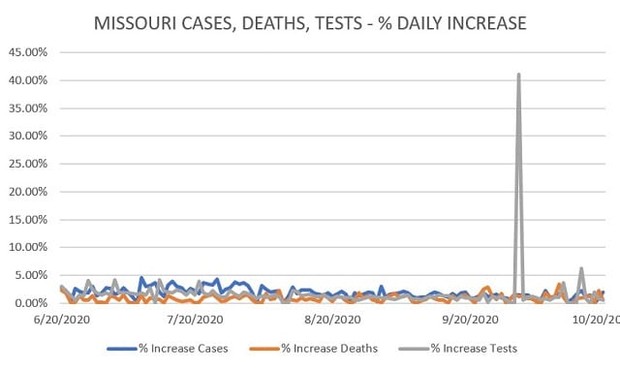
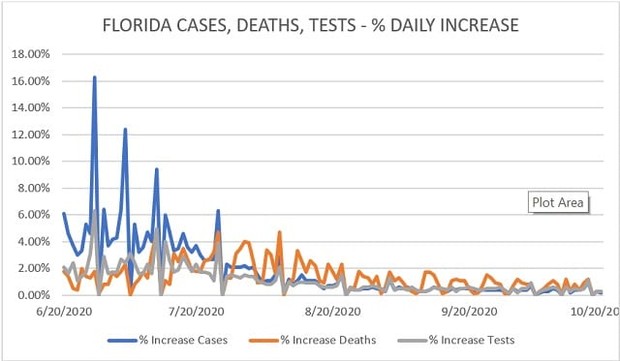
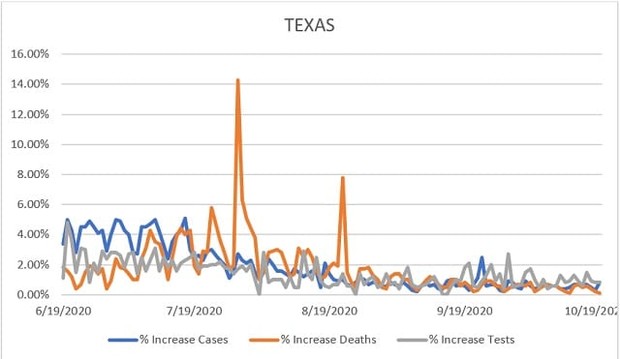
That really throws off the chart, though it’s still clear to see we’re not experiencing the types of surging that Florida and Texas had several months ago. (See their charts, below, for comparison.)
To give a slightly clearer visualization of how Missouri has been faring, I created a separate chart for Missouri which omits that one-day half-million jump in testing. So, you still see the smaller spike from last week, but the scale gives you a clearer visualization of our numbers (rates of increase) since mid-June.
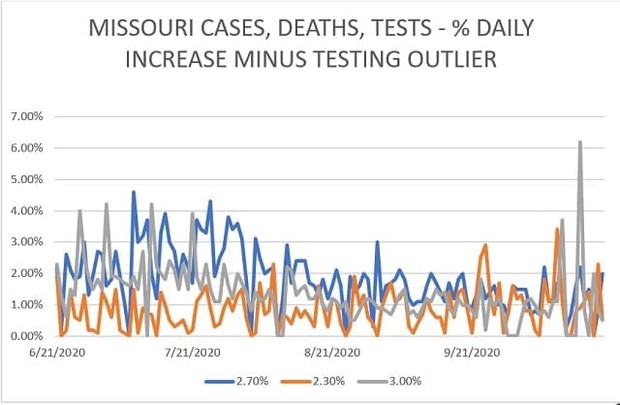
Overall, the blue line (daily % increase in cases) continues to outpace the gray line (daily % increase in tests). Again, though, both have generally outpaced the brown/orange line (daily % increase in deaths). Further, though there hasn’t been a notable decline, we’re also not seeing a sharp rise — despite the dire warnings. Yes, the raw number of new cases reported daily is higher, but the daily rate of increase is hovering just above 1%. Missouri’s rough case fatality rate (reported deaths divided by reported cases) has decreased slightly (from 1.7% to 1.6%). In comparison, the US rough case fatality rate is at 2.7% and New York’s still dwarfs these at 6.4%. New Jersey’s is 7.3%.
Missouri’s positivity rate (total reported cases divided by total reported tests) climbed as high as 9.3% (on September 29th) but then fell off when the testing number jumped on October 1st, and now sits at 6.9%. That remains slightly above the positivity rate for the U.S. as a whole — which has decreased to 6.7% — though still below that seen currently in Arizona, Florida, and Texas (12.0%, 13.2%, and 10.9% respectively).
Interestingly, yesterday, Wolf Blitzer identified Missouri as one of only two states in the country “not seeing spikes” in COVID cases.
Missouri is one of two states not experiencing a spike in COVID cases per @CNN's @wolfblitzer. #MOGov pic.twitter.com/6IFkNJyvpJ
— Mike Berg (@MikeKBerg) October 19, 2020
CNN appears to be relying on the Johns Hopkins University data, rather than Worldometers, so it’s difficult to make an apples-to-apples comparison. Based on Worldometers data, this characterization does not appear to be accurate. No, Missouri is not “spiking”, but neither are Arizona, Florida, Georgia, New York, Texas, or Oregon (all states whose Worldometers numbers I’ve been tracking daily.) The only one I’ve been tracking which appears to be “spiking” is Minnesota — and even that “spike” is hovering around the 1.4% daily rate of increase mark.
My take — particularly given that we’re two weeks out from THE MOST IMPORTANT ELECTION OF OUR LIFETIME!!!? Disregard the headlines and soundbites. Take a look at the actual numbers if you’re interested (ideally via your state’s health department website but, at minimum, using the same data set — e.g., Worldometers or Johns Hopkins — consistently.) And be careful (i.e., use your common sense) out there.


Join the conversation as a VIP Member